Covering the four weeks 29 September
2024 – 26 October 2024
According to BRC-Sensormatic
data:
-
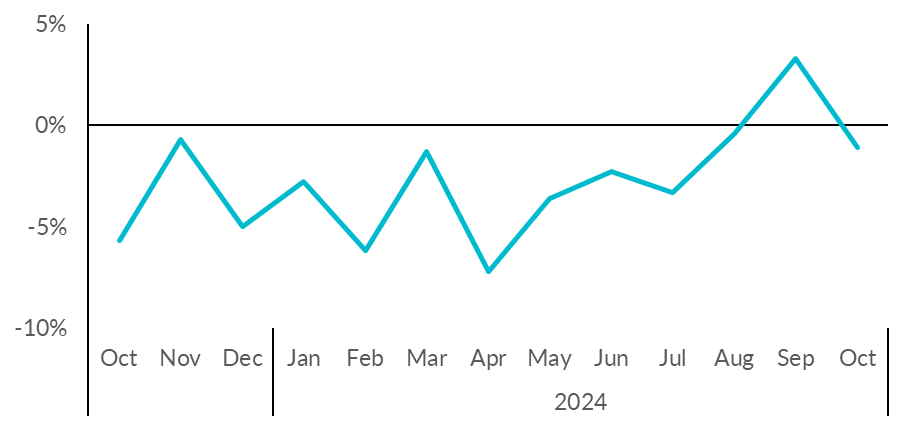
Total UK footfall decreased by 1.1%
in October (YoY), down from +3.3% in September.
-
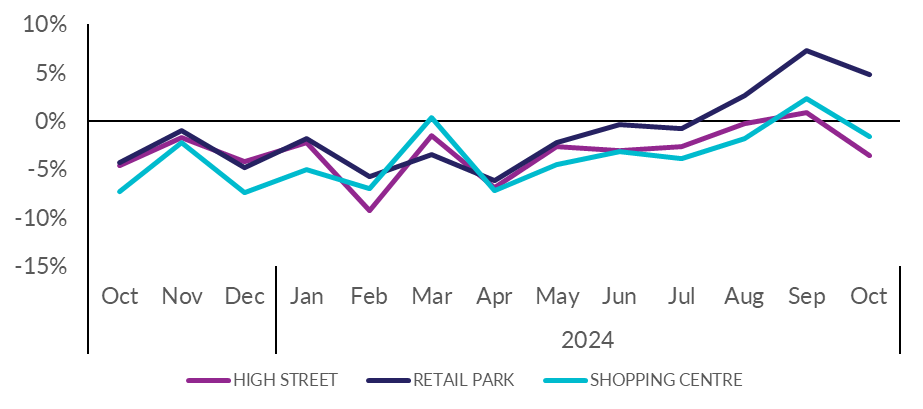
High Street footfall decreased by
3.6% in October (YoY), down from +0.9% in September.
-
-
Retail Park footfall increased by
4.8% in October (YoY), down from +7.3% in September.
-
Shopping Centre footfall
decreased by 1.6% in October (YoY), down from
+2.3% in September.
- Footfall increased YoY in three of the devolved nations,
while England experienced a decline.
-
Northern Ireland increased by
1.3% YoY
-
Scotland increased by 0.8% YoY
-
Wales increased by 0.4% YoY
-
England decreased by 1.5% YoY
Helen Dickinson, Chief Executive of the British Retail
Consortium, said:
“October's footfall figures showed a marginal decline compared to
last year, primarily due to half-term moving out of the
comparison. Despite the decline, retail parks continued to
attract shoppers, as they saw positive footfall growth for the
third consecutive month. Across England, the northern towns
performed best, with Leeds and Liverpool seeing positive footfall
last month.
“Retailers have seen footfall consistently fall since the
pandemic. Thriving high streets and town centres are not only
good for local economies but also form a key part of the social
fabric of communities up and down the country. With 6,000 stores
closing in the past five years, retailers now need a policy
environment that supports growth and investment.”
Andy Sumpter, Retail Consultant EMEA for Sensormatic,
commented:
“After the positive footfall performance we saw in September,
October's footfall dropped back into negative figures compared to
the year before. While this will be disappointing for many
retailers, who may have hoped the positive figures in September
would spell the start of a more consistent uptick in store
traffic, it perhaps shouldn't come as a surprise. We expect to
see a bumpy recovery as a myriad of market conditions - from the
cost of living to shaky consumer confidence around the Budget –
continue to make footfall performance volatile. Retailers now
need to look ahead and focus their efforts on the rest of the
Golden Quarter, delivering compelling reasons to visit in order
to drive ambient footfall and sales during the key Christmas
trading period.”
MONTHLY TOTAL UK RETAIL FOOTFALL (% CHANGE
YOY)

UK FOOTFALL BY LOCATION (% CHANGE YOY)

TOTAL FOOTFALL BY NATION AND REGION
|
GROWTH RANK
|
NATION AND REGION
|
Oct-24
|
Sep-24
|
|
1
|
West Midlands
|
+1.5%
|
+3.0%
|
|
2
|
Northern Ireland
|
+1.3%
|
+2.5%
|
|
3
|
North West England
|
+1.0%
|
+4.7%
|
|
4
|
Scotland
|
+0.8%
|
+0.7%
|
|
5
|
Wales
|
+0.4%
|
+5.4%
|
|
5
|
East Midlands
|
+0.3%
|
+3.6%
|
|
7
|
Yorkshire and the Humber
|
-0.5%
|
+4.2%
|
|
8
|
England
|
-1.5%
|
+3.6%
|
|
9
|
East of England
|
-1.8%
|
+4.7%
|
|
10
|
South East England
|
-2.1%
|
+5.2%
|
|
11
|
London
|
-2.5%
|
+2.5%
|
|
12
|
North East England
|
-3.6%
|
+1.1%
|
|
13
|
South West England
|
-5.0%
|
+4.6%
|
TOTAL FOOTFALL BY CITY
|
GROWTH RANK
|
CITY
|
Oct-24
|
Sep -24
|
|
1
|
Leeds
|
+1.8%
|
+6.9%
|
|
2
|
Glasgow
|
+1.6%
|
-1.0%
|
|
2
|
Liverpool
|
+1.3%
|
+1.8%
|
|
4
|
Edinburgh
|
+1.0%
|
+2.8%
|
|
5
|
Cardiff
|
0.0%
|
+3.9%
|
|
6
|
Manchester
|
-0.1%
|
+3.4%
|
|
7
|
Birmingham
|
-0.1%
|
-0.1%
|
|
8
|
Nottingham
|
-0.4%
|
+2.6%
|
|
9
|
Belfast
|
-0.6%
|
+3.7%
|
|
10
|
London
|
-2.5%
|
+2.5%
|
|
11
|
Bristol
|
-7.7%
|
+5.0%
|
-ENDS-
